One great season tells you less than you think. A striker scores twenty goals in a autumn and the transfer market loses its mind, yet the honest answer to "is this the new normal?" is usually: we don't know, and we won't know for a while. Small sample statistics is the discipline of admitting that, and it is the single most useful idea a football fan can borrow from the number-crunchers.
The word "small" is doing heavy lifting here. It simply means limited in size or amount — the plain sense Cambridge Dictionary gives it — and a small sample is any run of games too short to separate skill from luck. The trouble is that a season feels enormous from the inside. Thirty-eight matches, thousands of touches, a full winter of talking points. It feels like proof. It often isn't.
My position is simple: treat every breakout as a hypothesis, not a verdict. Some numbers settle quickly and deserve belief. Others wobble for years before they mean anything. Knowing which is which is the difference between a good signing and an expensive mistake.
Why does a hot streak fool us so easily?
Because the brain is a pattern machine running with the safety off. We see a player score in five straight matches and we build a story: new role, new confidence, the physical leap. The story is more satisfying than the boring alternative — that finishing runs hot and cold for everyone, and somebody is always on the hot end.
There's a second trap hiding underneath. The players we notice are the ones whose streaks happened where we were looking. A midfielder who racks up assists in a high-scoring team gets more credit than an equally good one stuck in a side that can't finish. The sample isn't just small; it's also tilted by context we barely register.
Watch a match twice, as I do — live for the feel, then on tape with the sound off — and the streak shrinks. On the second viewing you track the ten players away from the ball, and you notice the striker's five goals came against tired legs, or from a teammate's absurd run of form. The tape is humbling. That's the point of it.
Which statistics can you trust quickly?
Not all numbers are equally noisy. The useful rule of thumb: the more a stat reflects a repeatable skill under the player's own control, the faster it stabilises. The more it depends on teammates, opponents, refereeing and plain chance, the longer you must wait.
Think of it in three rough buckets.
- Fast to settle: things driven by disposition and role. How high a team presses, how many touches a defender takes, how often a winger takes his man on. These show up within weeks because they're choices.
- Medium: volume rates like shots per game or passes into the box. They stabilise over a decent chunk of a season, but they still swing with tactics and opposition.
- Slow: conversion numbers. Goals per shot, save percentage, penalties won, ball-in-play outcomes of any kind. These are where luck lives, and they can mislead for a full season or longer.
The practical consequence is uncomfortable for highlight culture. The eye-catching numbers — goals, assists, clean sheets — sit in the slowest bucket. The boring numbers — where a player receives the ball, what he does with it before the camera cares — are the trustworthy ones. We rank players by the least reliable evidence we have.
How big should a sample be before you believe it?
There is no magic number, and anyone who quotes one precise threshold for every sport is selling something. What the research tradition does support is that different measurements need different amounts of evidence, and that the conversion-type stats need the most. A full season is a reasonable floor for finishing metrics in football; a few months is often enough to judge a pressing scheme or a role change.
Sample size also interacts with opportunity. A winger who takes ten shots a month reaches a trustworthy conversion number far later than one who takes thirty, because the evidence accumulates with volume, not with calendar time. This is why a backup striker's hot October is close to meaningless while an every-week starter's is at least arguable.
And sport matters. In basketball, with far more possessions per game, rates stabilise faster than in football, where a striker might get three genuine chances a match. The same calendar stretch means a different amount of evidence. Comparing a player's November across sports is comparing apples to a single apple.
What this means for how you read a breakout season
Here's the debrief I'd give any fan or any scout willing to listen. When a player or a team rips through three months, ask four questions before you anoint them.
- Is the number a skill or a conversion? Shots and touches are skills. Goals per shot is a conversion. Trust in that order.
- Did the role change? A player moved inside, given a freer brief, or finally fit, can genuinely level up. That part of the story can be real even when the goal tally is flattered.
- How much of it was the teammates? The same striker in front of a different supply line is a different striker, statistically speaking.
- What does the second season say? The only true test of a breakout is whether the underlying numbers — the fast-settling ones — hold while the luck resets.
Our analysis across a lot of careers points one way: the players who sustain are the ones whose chance creation and ball-carrying held up even when the goals dipped. The ones who vanish are the ones whose only evidence was the goals themselves. The finish was the noise; the process was the player.
Clubs know this, which is why smart recruitment departments pay for underlying metrics and discount raw output — and why the market still overpays for the season that just happened. The gap between what the data says and what the auction pays is where good squads find their edges. It is also, incidentally, the logic behind why profit rules have reshaped whole transfer windows; when budgets tighten, overpaying for a hot year becomes a survival issue, as we covered in How Premier League Profit Rules Quietly Reshaped the Transfer Window. We covered a connected angle in How Premier League Profit Rules Quietly Reshaped the Transfer Window.
Does any of this excuse the player who regressed?
Yes, and it's worth saying plainly, because regression gets treated like a character flaw. A striker whose conversion rate falls back to earth hasn't stopped trying or lost his nerve. The unusual thing was the overperformance; the return is the system correcting the scoreline toward the skill. Cruelty toward the player is misplaced. The mistake was ours, in the reading.
The same courtesy applies to teams. A side that overperforms its expected results for half a season isn't "found out" when results normalise. It was riding variance, and variance always collects. Good coaches say this in press conferences and nobody believes them, because "we weren't as good as the table" is a terrible soundbite and a completely accurate sentence.
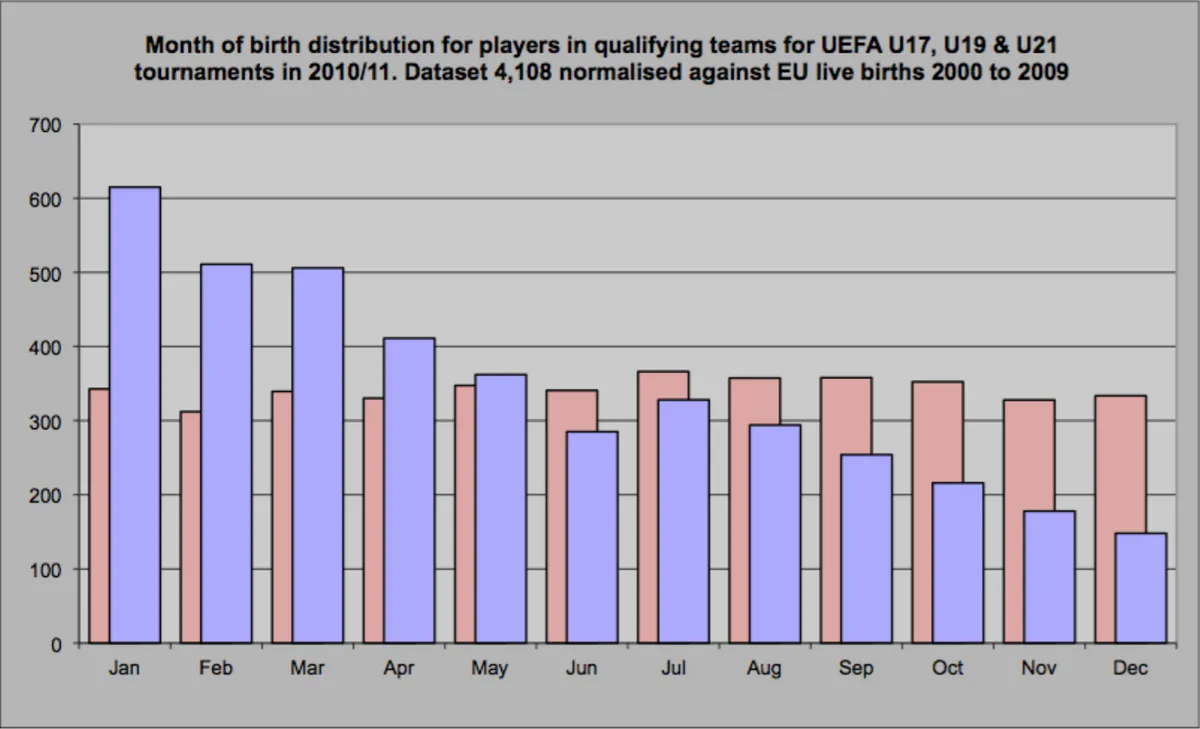
Where the idea genuinely earns its keep is at the youth level, which I saw from the touchline for years. A sixteen-year-old who dominates one age-group season may simply be an early developer, a few months of physical head start that the calendar erodes. Judging kids on a single year of growth spurts is small-sample thinking at its most consequential, and it wastes careers. Patience is not softness. It is measurement.
Where the evidence leaves us
What the numbers tradition has established is clear: some metrics stabilise within weeks, conversion stats need seasons, and no single year is a verdict. What remains genuinely unknown in any individual case is how much of a given breakout was real — the tape, the role, the underlying numbers, and time are the only tools that answer it, and time is non-negotiable.
So the next time a name explodes for three months and the transfer rumour mill spins up, hold the verdict. Check what kind of number it is. Check who was feeding it. Then wait for the part of the season where luck gets bored and leaves. The players still standing are the story. That's the whole case.
For more on how tactical choices show up quickly in the data — the fast-settling end of the spectrum — see How Defensive Pressing Triggers Win Possession Back in the Final Third, and for how rest decisions interact with performance noise, What Load Management Data Actually Shows About Resting Stars. Both sit in our wider analysis section.